Blogger使うのもそろそろ限界なので(Gifが何故かloopしなくなった;w;)、はてブロに移行します:
https://kenkawakenkenke.hateblo.jp(日本語)
https://kenkawakenkenke-en.hatenablog.com/ (English)
編集しやすくなってパワーアップした河本の実験室を引き続きご愛顧ください。
I'm moving this blog over to Hatena Blog:
https://kenkawakenkenke.hateblo.jp (Japanese)
https://kenkawakenkenke-en.hatenablog.com/ (English)
2019年1月6日日曜日
2016年2月24日水曜日
A booklight invisible to everyone but you
This is also true (for me) when reading on the airplane.
 |
| Off-the-shelf booklights are really bright from all around. |
From the reader, it's looks as bright as any other booklight,

but from an offset angle, it's hard to tell if it's even on or not.

As you can see, the further you move away from the front of the book (where the reader probably is), the light appears darker.
Because of this, you can read books in the dark without worrying about annoying those around you.

Make one for yourself
I also have a quick introductory video on how it works:
(1) Create the frame
I made a frame by hand-sawing wood, but it can really be anything. 3D print it if you like.
You have to make sure you make the measurements considering the size of the book.
Also attach some LEDs on the side.
These tape LEDs I used are pretty convenient.
You have to make sure you make the measurements considering the size of the book.
Also attach some LEDs on the side.
These tape LEDs I used are pretty convenient.

(2) Apply privacy filter
This is the most important step: go buy a privacy screen filter for tablets (like these) and apply it over your frame.

Privacy screen filters work to allow light travelling perpendicularly to the film through, but cuts light travelling at an angle.

By applying this over the LED, it lets only light that is travelling towards the reader, and makes it invisible to those around you, which is exactly what we want.

You may need to do some painting to ensure that light doesn't leak from gaps and cracks between the filter and the frame.
(3) The "page turning" switch
At the moment, there is a serious flaw with usability which is that, whenever you lift the booklight from the page you're reading (to turn the page), light leaks from beneath.
This means that for every page turn, people around you are treated to a flash of LED light.
This is why I added a tact switch to the bottom of the booklight which presses ON only when the booklight is placed on a book.
This means that the light turns itself off automatically when you're page turning, which is great!
Take a look at the video above to see how this works.

Attach a battery pack, and you're done.


An option you could do is add an off-tact switch to the top of the booklight too, so that if you place the booklight between pages, you can use it as a bookmarker (and it'll turn off automatically when you do.)
Another thing I've thought about is putting a sensor (e.g accelerometer) to measure your page turning, and detect when you've fallen asleep, to turn off automatically.
I've personally found this to be really useful, and it's allowed me to get back into the habit of reading books before going to sleep.
I'd love to hear feedback/suggestions, and hope others will try making one of their own.
Ken 16/02/24
「自分以外から見えない」ブックライトを作った
子供が隣で寝ているため、読書用のライト(ブックライト)を点けられなくなったからです。
|
| 市販のブックライト。眩しいので周りから怒られる。 |
読んでいる人からは煌々と照らされているように見えますが、
隣から見ると、ライトが点いているのが分からないレベルです。
不思議ですね。正面以外の角度から見ると急に暗くなります。これなら周りを邪魔する心配はありません。
作り方
こちらの動画にもまとめてあります:
(1) フレームを作る。
僕は木を切って作りましたが、3Dプリントでもなんでもいいです。
寸法は、読みたい本のサイズを考えながら計算しましょう。
そこに、テープ型LEDを設置します。
今回使ったのはLED Paradiseの3216chipLED 10連基板(¥780)です。
3Vで動き、そこそこ明るいのでおすすめです。
(2) 覗き見防止フィルムを貼る
ここがキモです。
覗き見防止フィルムを買ってきましょう。
ハードカバーの本のためにはタブレット用のフィルムがぴったり(¥6720)でした。結構高いです。
覗き見防止フィルムは、フィルムに対して直角の光は通し、角度のある光は遮断する働きをします。
これをLEDの上から貼ることで、正面(読者が居る方向)のみに光を出し、周りには光を漏らさないようにすることができます。

(3) ページめくりスイッチ
このままだと、一つ大きな弱点があります。
それは、ページをめくる時(ライトを本から持ち上げた時)に下から光を漏らしてしまうことです。ページめくりのたびにスイッチを一々切るのも面倒ですよね。
そこで、筐体の下部にタクトスイッチを設置し、本体がページから離れるとOFFになるようにしました。
こうすればページめくりの時は勝手にLEDが消えるので、周りに迷惑かけることがありません。
以上で完成です。
今回やってませんが、タクトスイッチを筐体の上部にもつけて、押された時にLEDが消えるようにすれば、本の間に(しおりとして)閉じると勝手にLEDが消えるってことも出来るんじゃないかと思います。
また、何らかのセンサ(加速度センサとか)を入れて読者が寝落ちしたことを検知し、勝手にLEDが消えるようにするというのもアリですね。
赤ちゃんが隣で寝ている時、
飛行機や病室で隣の人を気にせずに本を読みたい時、
敵地で地図を読みたい時など、
周りに光を漏らしたくない様々な状況に結構使えるんじゃないかと思います。
少なくとも僕はこれで本が読めるようになりました。
興味ある方は是非作ってみてください。

(3) ページめくりスイッチ
このままだと、一つ大きな弱点があります。
それは、ページをめくる時(ライトを本から持ち上げた時)に下から光を漏らしてしまうことです。ページめくりのたびにスイッチを一々切るのも面倒ですよね。
そこで、筐体の下部にタクトスイッチを設置し、本体がページから離れるとOFFになるようにしました。
こうすればページめくりの時は勝手にLEDが消えるので、周りに迷惑かけることがありません。
以上で完成です。
今回やってませんが、タクトスイッチを筐体の上部にもつけて、押された時にLEDが消えるようにすれば、本の間に(しおりとして)閉じると勝手にLEDが消えるってことも出来るんじゃないかと思います。
また、何らかのセンサ(加速度センサとか)を入れて読者が寝落ちしたことを検知し、勝手にLEDが消えるようにするというのもアリですね。
飛行機や病室で隣の人を気にせずに本を読みたい時、
敵地で地図を読みたい時など、
周りに光を漏らしたくない様々な状況に結構使えるんじゃないかと思います。
少なくとも僕はこれで本が読めるようになりました。
興味ある方は是非作ってみてください。
2015年12月31日木曜日
河本の実験室の2015年のまとめ
今年も残り数時間となりました。
本業とtempescopeに集中していたため大した開発はできてませんが、今年作ったものや遊んだデータを振り返ってみます。
2013年のまとめ
2014年のまとめ

そのうち中央線もデータが入手できるようになるだろうと期待してたんですが、まだ無いみたいですね。対応したらまた可視化してみます。

冗談半分で作ったのですが意外と便利で、8ヶ月経った今でも現役で使ってます。
DMM.makeでモデルをダウンロードしたり3Dプリントできるようにしてあるんですが、未だに印刷した人が僕以外いないみたいです。なんででしょう。便利なのに。

過去の首相毎の移動・食事パターンや、
これを更に将来のニュースと関連付けて解析したら面白いなぁ、と思いつつブログにもまとめないまま放置してしまいました。
ここで売ってるのですが、未だに注文0です。なんででしょう。

ブログを見てみただけると分かるように、ちょっと切り出してアニメーションにするだけで美麗な動画が簡単にできてしまいます。
自分の中でのピークは衛星写真から月を発見した瞬間です:

HDの容量がいっぱいになってしまったのでデータの蓄積を一旦やめてしまいましたが、来年3月には皆既日食があり、もう少し遊んでみようかなぁと思ってます。


去年開発したプロジェクションマッピングで部屋をマリオカートの世界に変えてしまうシステムを色々なところで発表してきました。

第8回ニコニコ学会β 研究してみたマッドネスで大賞をもらったり、

VRクリエイティブアワードで審査員特別賞をいただいたり、色々と楽しい思い出ができました。
プロジェクションマッピング×ゲームは可能性が沢山あり、(去年も言ってましたが)RomoCartの先を早く作りたいですね。
去年のまとめで掲げた2015年の目標は、「作って満足する」を繰り返すのではなく、ちゃんと最後(製品)まで持っていく、ということでした。
なので今年はtempescopeの製品化に尽力したんですが、結局tempescopeは製品化できず、いつにも増してやりっぱなしで終わってしまいましたね。
来年は30代に突入するということもあり、もう少し大きい物を作っていきたいと思います。
本業とtempescopeに集中していたため大した開発はできてませんが、今年作ったものや遊んだデータを振り返ってみます。
2013年のまとめ
2014年のまとめ

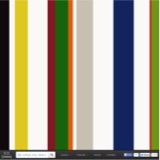
3月:140文字の「重み」を言語毎に比較してみた
ツイッターのデータを解析することで、140文字制限内ではどれぐらいの情報が伝えられるのか言語毎に比較してみました。思った通り中国語・日本語・韓国語が強いですね。
同じ140文字でも日本語のほうが英語より沢山書けて便利だよな、と思って各言語の「密度」を計算してみた。それぞれの言語で書かれたツイートを英語に自動翻訳した文章の長さと比較。中日韓語は英語より2~3倍ぐらい多く書ける。超お得。 pic.twitter.com/RJa2GlXuul
— Ken Kawamoto(ガリのほう) (@kenkawakenkenke) 2015, 3月 27
4月:山手線の混雑データで遊んだ
JRのデータをクローリングして山手線の車両の現在位置や車両毎混雑状況を解析して遊んでみました。公開されてないデータを無理やりクローリングして勝手に解析する、というパターンは色々世の中に知られていないことが発見できて楽しいです。そのうち中央線もデータが入手できるようになるだろうと期待してたんですが、まだ無いみたいですね。対応したらまた可視化してみます。

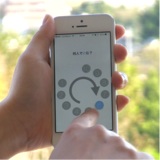
4月:携帯2台持ちが捗るスマホケースを作った
iPhoneとNexusの2台持ちをするようになったので、両方を一つにできるスマホケースを3Dプリンタで作ってみました。冗談半分で作ったのですが意外と便利で、8ヶ月経った今でも現役で使ってます。
DMM.makeでモデルをダウンロードしたり3Dプリントできるようにしてあるんですが、未だに印刷した人が僕以外いないみたいです。なんででしょう。便利なのに。

5月:首相の生活を分析してみた
新聞等で公開されている首相動静って要はライフログじゃん、ってことで首相動静をクローリング、自然言語解析して生活をデータ化してみました。過去の首相毎の移動・食事パターンや、
新聞の首相動静が無駄に細くて面白いので、クローリングして言語解析して、首相ライフログを作ってみた。緑の点は移動、赤の点は食事。こんな細かい情報公開しててセキュリティ大丈夫なんかね、日本は。 pic.twitter.com/7etUJ4VUA0
— Ken Kawamoto(ガリのほう) (@kenkawakenkenke) 2015, 5月 5
移動パターンなど、
首相の過去3年間の移動履歴を可視化しても特に面白いことは無かった。 pic.twitter.com/gWFb3cBE6A
— Ken Kawamoto(ガリのほう) (@kenkawakenkenke) 2015, 5月 6
ここまで知って大丈夫なのか、と不安になるほど細かく首相の生活を見ることができました。これを更に将来のニュースと関連付けて解析したら面白いなぁ、と思いつつブログにもまとめないまま放置してしまいました。
6月:脇汗が可愛くなるTシャツを作った
脇汗をかいても「なんとなくアリ」になるTシャツ「swea-T」(スウェッティー)をデザインしました。ここで売ってるのですが、未だに注文0です。なんででしょう。

7月:ひまわり8号の衛星写真で遊んでみた
今年の7月から公開になったひまわり8号の衛星写真データをクローリングして、色んな可視化をしてみました。ブログを見てみただけると分かるように、ちょっと切り出してアニメーションにするだけで美麗な動画が簡単にできてしまいます。
自分の中でのピークは衛星写真から月を発見した瞬間です:

HDの容量がいっぱいになってしまったのでデータの蓄積を一旦やめてしまいましたが、来年3月には皆既日食があり、もう少し遊んでみようかなぁと思ってます。
8月:「歌ってみた」人たちを勝手に合唱にしてみた
ネットにごまんと上がっている「歌ってみた」動画、普段はそこまで聴きたいものではないです。
でも同じ曲を歌ってる人たちを合成して勝手に合唱にしたら面白いんじゃないか、と思ってやってみたら何故か面白かったんです:
リンダリンダはなぜか最後ちょっと涙出そうになりますね。なんでだろう。
もっと事例増やしてウェブサービスにしようと思ってたんですが、権利関係が少し気になってやめました。
9月:子供の写真から3Dポップアップカードを自動生成するシステム
今年はこれを使ってクリスマスカードを作ろうとか意気込んでたんですが、そもそもクリスマスカードを送るのが面倒になってやめました。
でもそのうちちゃんとスマホアプリにして、誰でも使えるようにするつもりです。

10月:コーヒーの跡がニコニコになるマグカップ
コーヒーをよく飲むようになって机がすぐ汚れてしまうのに苛ついて、もっと汚れを愛せるようにしてみました。
こういうの多いですね、今年。
こういうの多いですね、今年。
いつも机をコーヒーの跡で汚しちゃうんで、こんなの作ってみました。 > コーヒーの跡がニコニコマークになるマグカップ http://t.co/bKTtoopsBi pic.twitter.com/4QtfnwOFyP
— Ken Kawamoto(ガリのほう) (@kenkawakenkenke) 2015, 10月 12
12月:曇った窓をディスプレイに変えるTOIKI
ロボット部分は既成品なので僕は制御プログラム書いただけなんですが、3年ぐらい前から作りたいと思っていたものなので喜びが大きかった作品です。
オープンソースロボットのmDrawBotを使い、曇った窓に天気や気温などの通知を書いたり、他の人の窓にショートメッセージを送ったりできるシステムを作りました。

出張先のホテルの窓に、朝起きて子供からのメッセージが描いてあったらちょっと泣くでしょ。僕だけですかね。

tempescopeのクラウドファンディングをした
2012年に開発した、部屋の中に雨を降らせる天気予報デバイスtempescopeは僕が手作りしていたオープンソース版から製品手前の試作版に成長し、ようやく今年の9月にIndiegogoでローンチしました。

残念ながら目標の70%しか集まらず未達成となってしまいましたが、世界中の何万人もの人たちに欲しいと言ってもらえたことは良い経験となりました。
やってみて初めて分かった、クラウドファンディングの沢山の落とし穴をどこかにまとめようと思いつつ、少し時間がたってしまいました。そのうち講演ででも喋ります。
ついでに個人的にもテレビ、新聞にも出る機会が増え、講演にも沢山呼ばれるようになりました。

RomoCartを色々発表したり受賞したり。

第8回ニコニコ学会β 研究してみたマッドネスで大賞をもらったり、

VRクリエイティブアワードで審査員特別賞をいただいたり、色々と楽しい思い出ができました。
プロジェクションマッピング×ゲームは可能性が沢山あり、(去年も言ってましたが)RomoCartの先を早く作りたいですね。
まとめ、抱負とか
なので今年はtempescopeの製品化に尽力したんですが、結局tempescopeは製品化できず、いつにも増してやりっぱなしで終わってしまいましたね。
来年は30代に突入するということもあり、もう少し大きい物を作っていきたいと思います。
2015年12月20日日曜日
お絵かきロボット「mDrawBot」で遊んだり窓にメッセージ描いてみたりしてみた
スイッチサイエンスがmDrawBotの販売を開始しましたね。
速攻で入手したので遊び倒してみました。


速攻で入手したので遊び倒してみました。

mDrawBotってなに?
PCから取り込んだ絵を卓上に描画するロボットや、卵に描画するロボットなど、4種類のロボットを作ることができます。
部品点数結構多いです。
組み立ては数時間かかりますが、アクリルと金属パーツが美しいので楽しく作れます。
完成です。ホワイトボードが小さいのでこういう雑な置き方ですが、会社とかにある大型のホワイトボードならすっきり置けそうです。

左右のステッピングモーターで糸の長さを調整し、三角形のプロッターを平面上で動かすことで、絵を描くという構造です。
またペンの上下(描く/描かない)はプロッターに固定されたサーボで制御されます。
またペンの上下(描く/描かない)はプロッターに固定されたサーボで制御されます。
とりあえず動かしてみる
(多分)一番下に追加説明しますが、OSXから動かすためには色々面倒な設定が必要です。
設定が終わったら標準ツールのmDraw.appでサンプルファイルを読み込み、
描いてみましょう。

2本の糸で吊るしている割にかなり安定してプロッターを制御できています。感心します。
失敗しやすいポイントとしては、糸が鉛直に近すぎる、もしくは水平に近すぎる状態になると、ステッピングモーターにかかる負荷が増大して脱調します。そうすると初期位置がずれるんで、それ以降の描画がズレてしまいます。
描画領域のどこに動かしても糸が45°ぐらいをキープするように、モーターや描画領域を設定しましょう。
プログラムから制御する
標準のmDraw.appはSVGファイルを読み込んで描画するだけのプログラムです。
これだと自由度が足りないんで、Javaのプログラムから制御できるようにしてしまいましょう。
実はmDrawBotの中身はArduino互換で、シリアル通信で制御できます。
オープンソースなので、スケッチのソースもちゃんと公開されてます。
ソースを読んでシリアル通信の通信仕様が分かったので、Javaから制御するためのライブラリ「jDrawBot」を作ってみました。ご自由にどうぞ。
mSpiderをUSBで繋いだ状態なら、こんな感じでプログラム上から操作できます:
Spider spider=new Spider();
spider.moveTo(new Location(-30,100));
spider.drawTo(new Location(30,70));
spider.moveTo(new Location(30,100));
spider.drawTo(new Location(-30,70));
→「×」印が描画されます。
ちなみに描画操作(moveTo、drawTo)は内部でジョブキューで管理してるんで、非同期にコマンドを送れます。
描画の完了を待ちたい場合はこうしましょう:
Blocker blocker=spider.drawTo(new Location(-30,70));
blocker.block();
プログラムから制御できればこっちのもん、色々遊んでみましょう。
GUIから絵を描く

PCの画面上で絵を描くと、それをホワイトボードに描いてくれるプログラムを作ってみました。
動画gifだと凄く見難いですが、画面に描いた「Hello」がそのままホワイトボードに書かれてます。「直接書けよ」感いっぱいですが、楽しいですね。
例えば会議が始まる前に「前回の打ち合わせ時のホワイトボードを再現しておく」みたいな新しい会議支援システムとか作れそうです。
例えば会議が始まる前に「前回の打ち合わせ時のホワイトボードを再現しておく」みたいな新しい会議支援システムとか作れそうです。
関数を描く

特に意味はないですが、グラフを描画したりもできます。
写真を描画する
基本的な遊び方が終わったあとは、プログラムで制御してるからこその遊び方をしてみましょう。
上の動画はPCのカメラで写真を撮影したあとOpenCVで線抽出し、ホワイトボードの絵を描くというデモです。
普通は手描きクオリティの絵しか存在しないホワイトボード上に写実的な絵が現れるのは不思議な体験です。

ホワイトボードを「コピペ」する
ホワイトボードの写真から線分抽出して、mDrawBotへの指令に変換して別のホワイトボードに描画するプログラムを作ってみました。
例えば会議室に設置しておいて打ち合わせが始まる前に前回の打ち合わせ時のホワイトボードの状態を再現しておく、とか捗りそうですね。
TOIKI:曇った窓をディスプレイとして使ってみる
ようやく本題です。こんなものを作ってみました:
ペンの先にスポンジをつけて、結露で曇った窓に文字を描くというデモです。
子供の頃、冬の寒い朝に指で絵を描いた記憶は誰でもありますよね?
もし朝起きて、窓に天気やお誕生日のメッセージなどが描かれてたら素敵じゃん?と思ってこういうものを作ってみました。

描いた文字は5分ほどで勝手に消えます。この刹那的な情報表示がなんとなく気に入ってます。ホテルとかにいいんじゃないですかね。
さいごに
たった2本の糸をステッピングモーターで動かす簡単な構造で、ここまで精度よく自由に遊べるロボットができるとは驚きました。
今回は糸で吊るす「mSpider」でしか遊んでませんが、他のロボットもそれぞれ色々ハックしがいがありそうです。
またRomoCart作った時も同じ事言ってましたが、プログラマー一人ではディスプレイの中の世界しか操作できません。だからこそ、プログラマーが実世界を簡単に制御できるようになるこういうキットは偉大だと思います。
是非mDrawBotをきっかけにハードの世界にも一歩踏み込んでみてはいかがでしょうか?
2015年10月11日日曜日
tempescopeがフィギュアケースとして優秀すぎる

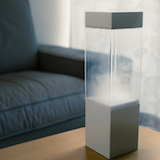
ただいまIndiegogoでクラウドファンディング中の「tempescope」は、天気予報等に基づき「明日の空」「どこか別の世界の空」を卓上に再現する物理ディスプレイです。
元々これを作った時に考えていたコンセプトは「空のジオラマ」です。
ジオラマの良さは無限の拡張性、せっかくなので空以外のものと組み合わせて遊んでみました。
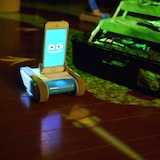
 |
| 雨の中で戦うカメックス。 |
 |
| 雷雨のDarth Vader。 |
 |
| せつない。 |
 |
| せつない。 |
これからのフィギュアやジオラマは天候も合わせて飾るのが新常識になると思うんですが、どうでしょう?
ちなみに雲を使えばこんな演出もできます。
雲として使ってないんで邪道ですが。

是非tempescopeのクラウドファンディング、ご支援よろしくお願いします。
2015年9月27日日曜日
Auto-generated popup cards from 3D point cloud data
As a parent, one of the things I like about owning a depth camera (like a Kinect or an Asus Xtion) is that you can take 3D photos of your child.


While there are many ways of doing this, I took the quick and dirty approach of simply clustering the points by the distance from the camera.
The image below shows the points as seen from the side, and a histogram of the number of points at each distance from the camera.
You can see that there are peaks in the histogram where there are objects (people, walls, etc). Simply k-means clustering this lets you (sort of) split the points into a small number of layers composed of points that come from spatially close objects.


This is great for immersing in old memories using things like the Oculus Rift,
but has the problem that you can't easily print them out and prop them up on your office desk, as you would do for normal photos.
Sure you could try 3D printing them, but they're still expensive (or really low resolution), and they still don't have the casual feel of printing out photos on paper. (They take up storage space, you can't keep one in your wallet, and they certainly can't be sent in an envelope.)
I noticed the possibility of using popup cards as an easy fix for this problem.
These are lightweight, can handle photo-level quality, and is 3D!
 |
| Popup cards, like the things you have in holiday cards. |
In this mini-project, I created a program that automatically generates popup cards from 3D point cloud data (collected from an Xtion).
How it works
1. Take a 3D photo of your kid
or your cat or whatever.

2. Cluster the 3D points into several "layers"
At the point cloud consists of individual coloured points floating in 3D space, which you can't just print onto paper.
Therefore you need to somehow reorganize the points into planes.
Therefore you need to somehow reorganize the points into planes.
While there are many ways of doing this, I took the quick and dirty approach of simply clustering the points by the distance from the camera.
The image below shows the points as seen from the side, and a histogram of the number of points at each distance from the camera.
You can see that there are peaks in the histogram where there are objects (people, walls, etc). Simply k-means clustering this lets you (sort of) split the points into a small number of layers composed of points that come from spatially close objects.
 |
| (Top) The original point cloud seen from the side (Bottom) Histogram of points for distance from camera |
This is an example of clustering into 2 layers. You can see that the point cloud was separated into objects in the foreground (1st layer) and the entire back wall (2nd layer).
 |
| Point cloud separated into 2 layers |
3. Merge the layers into a single card
Now that the point cloud is composed of planes, we can just merge them onto a single card, offsetting one layer from another slightly so that there's a 3D effect when they're cut out.
The below image was generated automatically from the layers, with the red lines added by the program to show where you should cut in order to make this card "popup"-able.
(There are actually some extra steps before this like cleaning the layers to ensure the card stands on its own, but I'm omitting this because it's boring.)
 |
| Cut the red dotted lines, and you get a 3D popup card. |
And here we have (a rendering of) a popup card:


4. Print it
You can just print the card generated as above, cut the red dotted lines, and you get this:
 |
| Popup baby! |
 |
| They're cheap and quick to mass produce. |
The photo quality of the cards is somewhat low (because of the quality of the Xtion camera), but I hope you see that having a 3D popup card literally adds a new layer of expressibility compared to ordinary photos.
Summary
In this project, I proposed and implemented a simple algorithm to auto-generate popup cards from 3D point cloud data generated from off-the-shelf cameras.
This provides a much cheaper alternative to 3D printing models, while also adding an extra dimension of expressibility compared to 2D photos.
- Requiring everyone to take 3D photos using a Kinect/Xtion might be slightly unrealistic, but there are certainly more approachable alternatives (like 3D digital cameras e.g FinePix 3D). We could also go towards a different direction, where we recognize objects from normal 2D photos and 3D-ify them.
- My main usecase for this is that I want to put (3D) photos of my kid on my work desk. There are actually many more benefits of this proposed method, like being able to fold them up and keep them in your wallet, or you could put them in an envelope and send them as holiday cards.
- I haven't released the source code or made this available as a webservice because I haven't had the time, but contact me if you're interested in making your own popup card.
- As a final side note, taking 3D photos of your family on occasions is highly recommended. They're great ways to look back on old memories.
登録:
投稿 (Atom)